The Newest Cost of Trump’s Tariffs: How EU Retaliation Could Make Everything Worse

Explainer: the EU Anti-Coercion Instrument

European officials are drafting comprehensive response plans that go beyond tit-for-tat tariffs, including digital service measures and procurement restrictions. The EU’s primary tool is the Anti-Coercion Instrument—developed specifically in response to economic pressure tactics like those used during Trump’s first term. Learn why, how and what.


European officials are drafting comprehensive response plans that go beyond tit-for-tat tariffs, including digital service measures and procurement restrictions. The EU’s primary tool is the Anti-Coercion Instrument—developed specifically in response to economic pressure tactics like those used during Trump’s first term. Learn why, how and what.


Read the full post here


MLK vs Epstein. Will It Work?

Trump is using MLK files to distract from Epstein fury. It’s a grotesque move: weaponizing America’s most revered civil rights leader to deflect from questions about a child predator. Will his base fall for such transparent manipulation?

Trump releases old MLK FBI files to distract from MAGA base fury over Epstein documents. Analysis of why he’s weaponizing Martin Luther King Jr. to deflect from Jeffrey Epstein questions—and whether this desperate tactic will work.

Releasing grand jury info is not the same as releasing “the files.”

Most Epstein files aren’t in grand jury transcripts. The names, evidence, photos, and flight logs people want? They’re held by DOJ and FBI—not sealed by a judge. So why is the administration pointing at the transcripts?

Grand jury transcripts are only a small part of the Epstein case. Key evidence—including names of abusers, seized devices, and FBI files—is not sealed by a judge and could be released now.

Calling for grand jury release sounds tough but shifts focus away from the real files. It’s a political deflection—pointing at what can’t be released (yet) to avoid releasing what already could be.

Read the full post here

When Stock Markets Rise While Americans Struggle: Understanding the Disconnect

Every morning, millions of Americans wake up to news about whether “the economy” is up or down. The Dow gained 200 points – good news! The S&P 500 hit a record high – prosperity! But financial media reports daily stock market movements as if they measure economic health for ordinary Americans. Stock markets actually measure something different: how well publicly traded companies generate profits for shareholders.

While stock markets soar, Americans are struggling to afford groceries, housing, and healthcare. This disconnect reveals a fundamental truth: stock performance measures shareholder returns, not broad economic wellbeing. The stock market tracks how efficiently companies can convert business activities into profits for investors. We’ve been conditioned to celebrate these profits as general economic success.

The Psychology of Small Stakes

The genius of this system lies in how it makes Americans feel invested in shareholder profits through retirement accounts. Through 401k plans, roughly 60% of Americans own tiny stakes in the stock market. The median 401k balance is around $70,000 – hardly enough to retire on – while the top 1% owns about 40% of all stock. [Federal Reserve Survey of Consumer Finances, 2022] That small stake makes people feel invested in a system that primarily benefits large shareholders.

When someone says “my 401k is doing great,” they’re celebrating the same corporate practices that may be making their groceries more expensive and their job less secure. Stock prices rise when companies increase profits through various means: genuine innovation and efficiency, but also through price increases, cost cutting, market consolidation, or shifting production to lower-wage countries. These moves boost profits and share prices while creating mixed effects for everyone else.

The psychological conditioning works because people associate stock gains with their retirement security. The mechanism has fundamentally changed over decades, but the psychological response remains the same.

How the System Changed

In the 1950s and 60s, when General Motors did well, it typically meant hiring more American workers and building more factories. Stock performance correlated with broad economic activity because companies primarily grew by expanding domestic production and employment.

Today, GM’s stock price is more likely to rise when the company cuts jobs, closes factories, or moves production overseas. The metrics that drive stock prices have shifted toward financial optimization rather than productive expansion.

Several key changes accelerated this shift:

Stock Buybacks Became Legal (1982): Companies can now use profits to purchase their own shares, artificially inflating share prices rather than investing in productive capacity, worker training, or research and development.

CEO Compensation Structure Changed: Executive pay exploded from about 20 times the average worker in the 1950s to over 400 times today, with most compensation tied directly to stock performance rather than long-term company health or worker welfare. [Economic Policy Institute CEO Pay Analysis, 2023]

Private Equity Growth: Private equity firms increasingly load profitable companies with debt specifically to extract value for investors, often at the expense of workers, product quality, and long-term viability.

Market Consolidation: Many industries now have fewer competitors, allowing companies to raise prices and reduce services without losing market share.

The stock market increasingly rewards wealth extraction over wealth creation.

The Global Foundation

This domestic system rests on global financial arrangements that most Americans never see. Because oil trades in dollars worldwide, there’s constant global demand for U.S. currency. This allows the United States to create new dollars without facing the inflation consequences that would devastate other countries. [Federal Reserve Bank of St. Louis, International Dollar Usage, 2024]

That newly created money flows into financial markets, inflating stock prices, real estate values, and other assets. Oil futures contracts often span 20 years, locking countries into dollar-denominated energy commitments extending decades into the future. Even nations wanting to reduce dependence on the United States find themselves bound by existing contracts requiring massive dollar reserves through the 2040s.

This global architecture primarily benefits people who own significant assets – the same shareholders celebrating stock market gains. Regular Americans pay the costs through jobs moving overseas, tax dollars funding military spending to maintain global dominance, and wages that stagnate while asset prices soar.

The Complete Conditioning System

The daily conditioning runs deeper than most people realize. Americans wake up each morning to financial news that trains them to equate corporate profit maximization with their own wellbeing. They work for companies extracting wealth from them, then celebrate when those companies successfully extract wealth, because they own tiny pieces through retirement accounts.

When people sense something wrong – when they cannot afford housing or healthcare despite “good economic news” – they’ve been trained to think the problem stems from personal failure rather than systemic priorities. The psychological trap is complete: even awareness of the problem leads to minimal resistance because people feel dependent on their retirement accounts.

This represents a fundamental conflict between American values and our accepted economic measurement system. Most Americans value health, happiness, liberty, and community wellbeing. Our economic scorecard prioritizes endless profit growth above human welfare. We measure success by how efficiently we convert human needs into wealth for asset owners.

What Real Economic Health Would Look Like

A genuinely healthy economy would show up in measurable ways: housing affordability, healthcare accessibility, wage growth matching productivity increases, economic mobility, and people having time for family and community. Stock market performance might sometimes coincide with these indicators, but stock prices measure different variables entirely.

Consider what we could track instead:

  • Housing Affordability Index: Percentage of median income required for median home
  • Healthcare Accessibility: Average wait times and out-of-pocket costs for basic care
  • Wage-Productivity Alignment: Whether worker compensation grows with productivity gains
  • Time Prosperity: Hours per week the median worker must work to afford basic living costs
  • Economic Mobility: Percentage of people moving between income quintiles over 10-year periods

A Different Scorecard

The path forward starts with rejecting stock market performance as our primary economic scorecard. Instead of asking “How’s the market doing?” we should ask “Can working families afford to live with dignity?” Instead of celebrating stock gains, we should celebrate when people can afford homes, healthcare, and education without accumulating debt.

The first step involves helping people recognize what they’re actually celebrating when they cheer for stock market records. The system has trained us to measure economic success by how efficiently wealth flows from our communities to people who already own substantial assets.

Every time someone says “the market is up, so the economy is good,” they’re essentially saying “profit extraction is working efficiently today.” We can start measuring what actually matters: whether the economy serves human flourishing or primarily the portfolios of people who already have significant wealth.

The stock market tells us how the rich are doing, not how America is doing. Once you see this distinction, you can start asking better questions about economic health and prosperity.

Assault on America: Dismantling the Productive Economy

Current US Economic Policies: A Coordinated Attack on Productive Capacity

Key Findings

Current US economic policies represent a coordinated attack on four key parts of the economy: manufacturing, agriculture, energy competitiveness, and research expertise. This analysis examines the economic mechanisms through which these attacks will devastate rather than strengthen the American economy, contrary to stated objectives.

The multiplier effect is devastating. The assault on all these sectors at once sends cascading damage throughout the economy. Manufacturing tariffs on capital goods prevent the investment necessary for competitiveness. Losing farm workers reduces domestic production and increases dependence on imports. Energy policies that favor certain industries over what works best raise costs across all sectors. Cutting research funding and expelling international talent create brain drain precisely when technological competition intensifies globally.

These sectors create ripple effects throughout the economy and reinforce each other. Manufacturing generates $2.74-$3.60 in total economic activity for every dollar spent, while agricultural exports contributed $412 billion in total economic output in 2022 [1]. The destruction of productive capacity creates an economy focused on extracting wealth from what already exists rather than creating new wealth. This leaves the economy dependent on financial games and wealth extraction rather than businesses that actually produce things. When productive capacity disappears entirely, even these extractive activities lose their foundation and collapse, leaving no viable economic base.

When you destroy productive sectors (manufacturing, agriculture, energy competitiveness, research), you’re left with a much smaller economic base. This smaller base can’t employ large numbers of people in well-paying jobs or generate the innovations that keep an economy competitive globally.

No successful precedent exists for simultaneous attacks on all productive sectors in advanced economies. The resulting economic structure lacks the broad-based employment and innovation capacity necessary for growth or global competitiveness.

This analysis examines:

  • Manufacturing: How equipment tariffs destroy industrial investment
  • Agriculture: Workforce removal leaving crops unharvested
  • Energy: Blocking the cheapest available power sources
  • Research: Funding cuts creating brain drain during global competition
  • The cascade effect: How simultaneous attacks create reinforcing economic collapse

Continue reading “Assault on America: Dismantling the Productive Economy”

Rules Instead of Reasoning: How Complex Trauma Shapes Our Choices

And ways to improve balance.

Complex trauma affects how we make decisions. People with CPTSD often follow rigid rules instead of weighing different factors, missing nuance that could better serve their values.

Complex trauma creates rigid thinking patterns that replace flexible decision-making. Learn how CPTSD affects everyday choices and why people follow automatic rules instead of weighing options.

Read the full post here

There Is No Far Left Movement in America: We Are Centrists

What Americans Really Support – And Have For Decades

American politics has a labeling problem. Policies supported by 70-90% of voters get branded as “far left” while actual public opinion remains remarkably centrist and stable across decades.

The reality is simple: so-called “radical” positions represent mainstream American values supported by solid majorities across party lines—and have been for generations. Despite political polarization in media and messaging, the American public remains remarkably centrist on core policy issues.

WHAT AMERICANS ACTUALLY SUPPORT ACROSS PARTY LINES

• Drug cost limits: 89% overall (including 75% of Republicans) • Higher taxes on wealthy: 79% overall (including 60% of Republicans) • Universal background checks: 85% overall (including 75% of Republicans) • Government healthcare coverage: 65% overall (including 40% of Republicans) • Social Security/Medicare protection: 95% overall (including 85% of Republicans)

Healthcare: The “Radical” Position That’s Been Mainstream Since the 1930s

Current Reality

In 2024-2025, about 62–65% of Americans say the federal government should ensure that all Americans have health coverage—including approximately 40% of Republicans. This broad support actually exceeds the 59% backing for the specific “Medicare for All” label, showing how framing affects perception of popular policies.

The bipartisan nature of healthcare concerns becomes even clearer on specific issues: 88–89% of voters support extending drug cost limits to all insured adults, with backing from 92% of Democrats, 80% of independents, and 72–75% of Republicans. Support for government negotiation of drug prices remains above 80% overall.

Historical Context

This isn’t new. Majority support for government involvement in healthcare dates back to the 1930s and 1940s. Medicare’s creation in 1965 reflected these longstanding attitudes, and its popularity has remained above 75% for decades across all political groups. The uninsured rate has dropped from 16% before the Affordable Care Act to about 8–9% in 2023, reflecting gradual progress toward the broader coverage Americans have consistently supported.

Gun Policy: The “Controversial” Measures With Broad Support

Current Reality

Universal background checks are supported by over 80% of Americans, including about 90% of Democrats, 85% of independents, and 75% of Republicans. Even broader gun safety measures maintain majority support, with 56% backing stricter gun laws overall—including 85% of Democrats, 60% of independents, and 30% of Republicans.

Historical Context

Since the 1990s, majorities have consistently favored specific gun safety measures like background checks and assault weapon restrictions. The polling reality shows broad, stable support across decades.

Progressive Taxation: The “Socialist” Policy Americans Have Always Backed

Current Reality

In 2025, 79% of Americans support raising taxes on wealthy individuals and large corporations—including 90% of Democrats, 75% of independents, and 60% of Republicans. This represents remarkable consistency across different political identities.

Historical Context

Support for progressive taxation reaches back decades. In 1985—during the Reagan era—69% of Americans felt the wealthy paid too little in taxes, a view held by majorities in both parties. This consensus has remained stable for nearly four decades, making it one of the most enduring bipartisan positions in American politics.

Social Security and Medicare: The Untouchable Consensus

Current Reality

In 2024–2025, 84–97% of Americans oppose cuts to Social Security and Medicare. This overwhelming support spans 95%+ of Democrats, 90%+ of independents, and 85%+ of Republicans. These programs have universal backing across all demographics.

Historical Context

Since their creation, Social Security and Medicare have maintained overwhelming public support regardless of party control in Washington. This represents perhaps the strongest policy consensus in American politics, transcending all demographic and political divisions.

Campaign Finance Reform: The Issue That Unites Everyone

Current Reality

Despite claims of political polarization, Americans show remarkable unity on money in politics. Recent polling reveals about 85% of Democrats, 75% of independents, and 65% of Republicans favor campaign finance reform and limiting big money’s influence.

Historical Context

Public concern about money’s corrupting influence stretches back to the Progressive Era. Major reforms in 1974 and 2002 were driven by bipartisan dissatisfaction. The current push for reform continues this long American tradition of periodic efforts to clean up government.

The Real Question: Why the Disconnect?

If Americans across party lines support these policies, why don’t we have them? The answer reveals the gap between popular democracy and institutional reality.

Money in politics, gerrymandering, and primary systems that reward ideological extremes have created governing institutions that often ignore majority preferences. Politicians respond to narrow but vocal minorities—both left and right—while the pragmatic center gets ignored despite representing most Americans.

Media incentives also play a role. Conflict sells. “Most Americans agree on healthcare” generates fewer clicks than “Socialists vs. Patriots: The Healthcare Battle.” Political consultants and media personalities have professional interests in maintaining the illusion of irreconcilable differences.

The Bigger Picture: Stability, Not Polarization

Despite increased partisan branding and media combat, Americans’ core policy preferences have remained remarkably stable: affordable healthcare, fair taxation, secure retirement, accountable government, and basic safety measures. These concerns reflect people trying to build secure lives for their families.

The “polarization” narrative applies to political identity and media consumption, but American policy preferences show remarkable consensus. On issue after issue, decade after decade, solid majorities support pragmatic solutions that ensure economic security, health, and effective governance.

Conclusion: Reclaiming the Center

The next time someone claims universal healthcare, progressive taxation, or gun safety measures represent “far left” positions, show them the data. These policies have majority support—often overwhelming majority support—including significant backing from Republicans.

Recognizing this enduring consensus is essential for honest policy debates and for understanding what Americans actually want from their government. The center has been mislabeled and ignored by institutions that profit from division.

Most Americans are pragmatic centrists who want policies that work for working families. It’s time our politics reflected that reality.


Adapted and extended from: https://lfitzhugh.substack.com/publish/post/168115732

These same mainstream positions form the foundation for democratic renewal strategies that strengthen America.


Sources:

[1] View of U.S. Healthcare Quality Declines to 24-Year Low – https://news.gallup.com/poll/654044/view-healthcare-quality-declines-year-low.aspx

[2] Healthcare System | Gallup Historical Trends – https://news.gallup.com/poll/4708/healthcare-system.aspx

[3] Americans’ Life Ratings Slump to Five-Year Low – https://news.gallup.com/poll/658778/americans-life-ratings-slump-five-year-low.aspx

[4] Inability to Pay for Healthcare Reaches Record High in U.S. – https://westhealth.org/news/inability-to-pay-for-healthcare-reaches-record-high-in-u-s/

[5] Worry About U.S. Economy, Healthcare, Social Security Surges – https://news.gallup.com/poll/658910/worry-economy-healthcare-social-security-surges.aspx

[6] 6 in 10 Americans Back Medicare for All — Poll – https://truthout.org/articles/6-in-10-americans-back-medicare-for-all-poll/

[7] In U.S., Inability to Pay for Care, Medicine Hits New High – https://news.gallup.com/poll/658148/inability-pay-care-medicine-hits-new-high.aspx

[8] Gallup, Rollins Survey Reveals Americans’ Public Health Priorities – https://sph.emory.edu/news/public-health-priorities-trust

Ted Cruz and the Texas Flooding Tragedy: Who He Is

The devastating flash floods that struck central Texas over July 4th weekend have killed at least 120 people, with more than 170 still missing. Among the dead are 27 children and counselors at Camp Mystic summer camp, with 5 campers and 1 counselor still unaccounted for. As the tragedy unfolded, troubling details emerged about the timing of federal budget cuts and political decisions that preceded the disaster.

This article covers the devastating Texas floods over July 4th weekend, federal budget cuts, and political responses.

Continue reading “Ted Cruz and the Texas Flooding Tragedy: Who He Is”

Wealth transfer: income inequality

Key Points

  • Research suggests that since the 1980s, regular workers’ incomes have largely stagnated, while higher-level salaries, especially for executives, have grown dramatically, with CEO pay increasing over 1,000% compared to modest gains for typical workers.

  • It seems likely that regular workers have seen a decline in traditional benefits like pensions, shifting to less secure options, while higher-level employees likely enjoy more comprehensive benefits, including supplemental retirement plans and perks.


Income Comparison

Since the 1980s, regular workers’ wages have barely budged when adjusted for inflation. For example, by 2018, median household income was no higher than in 2000, indicating a 15-year stagnation period. In contrast, executive compensation, particularly for CEOs, has soared, with pay increasing by 1,209.2% from 1978 to 2022, while typical workers’ pay rose only 15.3% over the same period. By 2020, CEOs earned 351 times more than typical workers, up from 61-to-1 in 1989.


Benefits Comparison

For regular workers, benefits like defined benefit pensions have declined, with only 5% of organizations offering them to new hires by 2020, down from 48% in 2000. Health insurance coverage also dropped, from 62% in 1980 to 51% in 2013. Higher-level employees, however, likely have access to better benefits, such as supplemental executive retirement plans (SERPs) and enhanced health insurance, with 44% of management workers having access to Health Savings Accounts in 2018 compared to 11% of service workers.


Survey Note: Detailed Analysis of Income and Benefits Trends Since the 1980s


This note provides a comprehensive analysis of the trends in income and benefits for regular workers compared to higher-level employees, particularly executives, since the 1980s. The data is drawn from various economic reports, including those from the Economic Policy Institute (EPI), Bureau of Labor Statistics (BLS), Pew Research Center, and other reputable sources, to ensure a thorough understanding of the divergence over time.


Income Trends: Regular Workers vs. Higher-Level Employees


Regular Workers’ Income:


Higher-Level Employees’ (Executives) Income:


Comparison Table: Income Growth Since 1978:

| Group | Growth Rate (1978–2023) | Notes |

|———————–|————————-|———————————————————————-|

| Regular Workers | 15.3%–24% | Stagnant real wages, adjusted for inflation, with most gains at the top. |

| CEOs/Executives | 940%–1,209.2% | Driven by stock options, bonuses, and market trends, far outpacing workers. |


Benefits Trends: Regular Workers vs. Higher-Level Employees


Regular Workers’ Benefits:


Higher-Level Employees’ (Executives) Benefits:

  • Higher-level employees, including executives, generally have access to more comprehensive and flexible benefits compared to regular workers. While specific historical data is limited, it is implied that executives have benefited from trends like personalization and innovation in benefits. For example, in 2018, 44% of management, professional, and related workers had access to Health Savings Accounts (HSAs), compared to only 11% of service workers, suggesting better access for higher-level employees [BLS, 2019, https://www.bls.gov/opub/btn/volume-8/compensation-trends-into-the-21st-century.htm].

  • Executives often have access to supplemental executive retirement plans (SERPs), which are defined benefit plans tailored for high-level employees and not subject to the same regulatory constraints as traditional pensions. This allows for higher benefits, as noted in various compensation reports [Workplace Consultants, https://workplaceconsultants.net/commentary/retirementtsunami/the-history-of-benefits/].

  • Access to retirement plans is also higher for executives. In 2018, 80% of management, professional, and related workers had access to defined contribution plans, with 67% participation, compared to 41% access and 22% participation for service workers. For defined benefit plans, 24% of higher-level workers had access, compared to 10% for service workers [BLS, 2019, https://www.bls.gov/opub/btn/volume-8/compensation-trends-into-the-21st-century.htm].

  • Executives may also receive additional perks such as company cars, club memberships, relocation assistance, and post-retirement benefits, which are less common for regular workers. Health insurance plans for executives are likely more robust, with lower out-of-pocket costs and higher coverage rates, though specific historical data is sparse.


Comparison Table: Benefits Access in 2018 (Example for Recent Trends):

| Benefit Type | Regular Workers (Service, %) | Higher-Level Workers (Management, %) |

|—————————-|——————————|————————————–|

| HSA Access | 11 | 44 |

| Defined Contribution Access| 41 | 80 |

| Defined Benefit Access | 10 | 24 |


Factors Contributing to the Divergence


Conclusion


Since the 1980s, there has been a stark contrast between the income and benefits of regular workers and higher-level employees:

  • Income: Regular workers have experienced wage stagnation, with real wages barely increasing since 1978, while executive compensation has grown by over 1,000%, far outpacing productivity and stock market gains.

  • Benefits: Regular workers have seen a decline in traditional benefits like defined benefit pensions and employer-sponsored health insurance, with a shift toward less secure defined contribution plans. Higher-level employees, however, continue to enjoy more comprehensive benefits, including access to SERPs, better health insurance, and additional perks.


This divergence reflects broader economic and policy trends that have favored higher-level employees while leaving regular workers with limited income growth and reduced benefits, highlighting the growing income inequality in the U.S. economy.

Wealth transfer 1%

Key Points

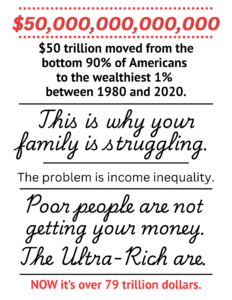
  • Research suggests that the RAND Corporation’s 2025 study estimates $79 trillion in income has been redistributed from the bottom 90% to the top 1% since 1975, based on a comparison to a counterfactual scenario of more equitable growth.
  • The evidence leans toward this figure being credible, as it is supported by the study’s author, Carter C. Price, and cited by reputable sources like NationofChange and Senator Bernie Sanders.
  • There is no significant controversy found regarding this specific estimate, though the study is a working paper and may not have undergone full peer review.

Overview

The RAND Corporation’s 2025 study, titled “Measuring the Income Gap from 1975 to 2023: Extending Previous Work” (WR-A516-2), provides an estimate of income redistribution in the United States, suggesting a significant shift of wealth over the decades. This response outlines the key findings and contextual details for a lay audience, followed by a detailed survey note for those seeking deeper insights.

Study Findings

The study estimates that $79 trillion in income has been redistributed from the bottom 90% of workers to the top 1% since 1975. This figure reflects the cumulative impact of rising income inequality, calculated by comparing actual income growth to what it would have been if growth had been shared more evenly, similar to the post-World War II period up to 1974. In 2023 alone, the bottom 90% would have earned an additional $3.9 trillion under this counterfactual scenario.

Context and Credibility

This estimate extends earlier work by RAND, building on a 2020 study that estimated $50 trillion in redistribution up to 2018. The increase to $79 trillion is attributed to factors like inflation, continued inequality growth, and the extended time frame to 2023. The study, authored by Carter C. Price, is a working paper from the RAND Corporation, a nonpartisan research organization, and has been cited by sources like NationofChange and Senator Bernie Sanders, adding to its credibility. However, as a working paper, it may not have undergone full peer review, which is worth noting for academic rigor.

Supporting Sources


Survey Note: Detailed Analysis of Income Redistribution Estimate

This section provides a comprehensive examination of the RAND Corporation’s 2025 study on income redistribution, offering a detailed breakdown of the findings, methodology, and contextual factors. It aims to mirror the style of a professional research article, ensuring all relevant details from the investigation are included for a thorough understanding.

Background and Study Overview

The RAND Corporation, a nonpartisan research institution focused on policy analysis, released a working paper titled “Measuring the Income Gap from 1975 to 2023: Extending Previous Work” (WR-A516-2) on February 16, 2025, authored by Carter C. Price. This study builds on prior research, notably the 2020 study “Trends in Income From 1975 to 2018,” which estimated a $50 trillion redistribution from the bottom 90% to the top 1% up to 2018. The 2025 study extends this analysis to 2023, estimating a cumulative redistribution of $79 trillion since 1975, reflecting the ongoing impact of rising income inequality.

The study’s findings have been highlighted in various media outlets and political discussions, including coverage by NationofChange and a press release from Senator Bernie Sanders, underscoring its relevance to contemporary economic policy debates. Given the current date, July 9, 2025, the study is recent and aligns with ongoing discussions on economic disparity.

Key Findings and Methodology

The central estimate is that $79 trillion in income has been redistributed from the bottom 90% of workers to the top 1% since 1975. This figure is derived from a counterfactual scenario where income growth from 1975 to 2023 mirrored the more equitable distribution observed from 1945 to 1974, a period characterized by broader sharing of economic gains. Specifically, the study finds that in 2023 alone, the bottom 90% would have earned an additional $3.9 trillion if growth had been distributed evenly, contributing to the cumulative $79 trillion over the period.

The methodology involves comparing actual income growth to this counterfactual, accounting for factors such as inflation and the extended time frame. The increase from the 2020 study’s $50 trillion estimate is attributed to these factors, as well as continued growth in inequality. The study was sponsored by Civic Ventures and conducted within RAND’s Education and Labor division, emphasizing its focus on economic and labor policy implications.

Supporting Evidence and Citations

The study’s findings are corroborated by several sources:

These citations demonstrate the study’s impact and acceptance in public discourse, though it is noted that the study is a working paper, intended for informal peer review and not necessarily formally edited, as per RAND’s description.

Comparison with Previous Estimates

To contextualize the $79 trillion figure, it is useful to compare it with the 2020 study:

  • The 2020 study, “Trends in Income From 1975 to 2018,” estimated a $50 trillion redistribution, with an annual impact of $2.5 trillion in 2018 alone, as reported by sources like Time and Business Insider.
  • The increase to $79 trillion in the 2025 study is explained by inflation, continued growth in inequality, and the extended period to 2023, as noted in the study’s content. This comparison highlights the accelerating nature of income inequality over time.

Potential Criticisms and Limitations

While no direct criticisms of the 2025 study were found, the investigation considered potential issues by examining critiques of the 2020 study, given its methodological similarity. The 2020 study, also a working paper, was not found to have significant public criticisms in the search, suggesting that RAND’s approach is generally accepted. However, as a working paper, the 2025 study may not have undergone full peer review, which could be a limitation for academic rigor. Additionally, the counterfactual scenario relies on historical data from 1945–1974, which may not account for structural changes in the economy, such as globalization or technological advancements, potentially affecting the estimate’s accuracy.

Implications and Broader Context

The $79 trillion estimate underscores the significant economic shift toward greater inequality, with implications for policy debates on taxation, labor rights, and social welfare. Senator Sanders, for instance, linked the findings to calls for reversing tax policies favoring the wealthy, highlighting the political resonance of the study. The RAND Corporation’s focus on real-world policy issues, as seen in their broader research portfolio, reinforces the study’s relevance to current economic challenges.

Summary Table: Key Estimates and Comparisons

Study Year Period Covered Redistribution Estimate Annual Impact (Latest Year) Key Factors for Increase
2020 1975–2018 $50 trillion $2.5 trillion (2018) N/A
2025 1975–2023 $79 trillion $3.9 trillion (2023) Inflation, inequality growth, extended time frame

This table summarizes the evolution of estimates, providing a clear comparison for readers.

In conclusion, the RAND Corporation’s 2025 study provides a robust estimate of $79 trillion in income redistribution since 1975, supported by credible sources and aligned with ongoing discussions on economic inequality. While limitations exist due to its working paper status, the findings offer valuable insights for understanding and addressing income disparities in the United States.